1
2
3
4
5
6
7
8
9
10
11
12
13
14
15
16
17
18
19
20
21
22
23
24
25
26
27
28
29
30
31
32
33
34
35
36
37
38
39
40
41
42
43
44
45
46
47
48
49
50
51
52
53
54
55
56
57
58
59
60
61
62
63
64
65
66
|
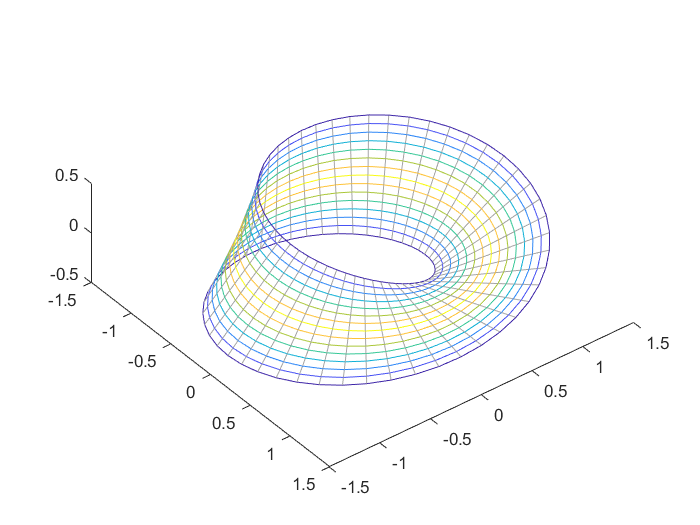
function fig_mobius(num1,num2,k)
if nargin==0
num1=randi([40,60]);num2=randi([10,20]);k=randi([0,1]);
end
mobius=@(t,phi) [(1+t/2*cos(phi/2)).*cos(phi);
(1+t/2*cos(phi/2)).*sin(phi);
t/2*sin(phi/2)];
phin=linspace(0,2*pi,num1);
tn=linspace(-1,1,num2);
figure(1);hold on;
xlim([-1,1]*1.5);ylim([-1,1]*1.5);zlim([-1,1]*0.5);
view([52,67]);
switch k
case 0
for i=1:num2
temp=mobius(tn(i),phin);
plot3(temp(1,:),temp(2,:),temp(3,:),'color','blue');
pause(2/num2);
end
case 1
color_table=parula;
[numc1,~]=size(color_table);
xt=linspace(0,1,numc1);
numc2=ceil(num2/2);
xq=linspace(0,1,numc2);
tempc=interp1(xt,color_table,xq);
for i=1:numc2
temp1=mobius(tn(i),phin);
temp2=mobius(tn(num2-i+1),phin);
plot3(temp1(1,:),temp1(2,:),temp1(3,:),'color',tempc(i,:));
plot3(temp2(1,:),temp2(2,:),temp2(3,:),'color',tempc(i,:));
pause(2/numc2);
end
otherwise
error('INPUT k must be 0 or 1');
end
for i=1:num1
temp=mobius(tn,phin(i));
plot3(temp(1,:),temp(2,:),temp(3,:),'color',[0.65,0.65,0.65]);
pause(1.5/num1);
end
end
|